In this article we will discuss about:- 1. Introduction to Train Movement and Energy Consumption 2. Typical Speed-Time Curves 3. Crest Speed, Average Speed and Schedule Speed of Train 4. Simplified Speed-Time Curves of Train 5. Mechanics of Train Movement 6. Tractive Effort for Propulsion of Train 7. Power Output from the Driving Axles 8. Energy Output from Driving Axles and Other Details.
Introduction to Train Movement and Energy Consumption:
The movement of trains and their energy consumption can be most conveniently studied by means of speed-time and speed-distance curves, which show respectively the speed at different time instants after the start of run and the speed at different distances from the starting point. Of the two, the speed-time curve is generally the more useful.
The curve drawn between speed and time, taking speed (in km/hour) on the Y-axis and time (in seconds or minutes) on X-axis, is known as speed-time curve. The speed-time curve provides complete information of the motion of the train. This curve gives the speed at various time instants after the start of run directly. Slope of the curve at any point gives the acceleration at the corresponding instant or speed. The area covered by the curve, the time axis and the ordinates through the instants between which the time is taken, represents the distance covered in the corresponding time.
Speed-time curve (Fig. 11.1) mainly consists of:
ADVERTISEMENTS:
(i) Initial acceleration
(ii) Constant speed run or free run
(iii) Coasting and
(iv) Retardation.
ADVERTISEMENTS:
Typical speed-time curve for main line service is shown in Fig. 11.1.
(i) Acceleration:
It consists of two parts known as:
ADVERTISEMENTS:
(a) Constant acceleration or acceleration while notching up and
(b) Speed curve running or acceleration on the speed curve.
(a) Constant Acceleration or Acceleration during Notching Up:
During notching up period (0 to t1) the current is maintained approximately constant and the voltage across the motor is gradually increased by cutting out the starting resistance. Thus tractive effort is constant and, therefore, acceleration remains constant during this period.
ADVERTISEMENTS:
(b) Speed Curve Running or Acceleration on Speed Curve:
During speed curve running (t1 to t2) the voltage acting across the motor remains constant and current starts decreasing with the increase in speed according to the characteristics of the motor and finally the current taken by the motor becomes constant. During this period, though the train accelerates but acceleration decreases with the increase in speed and finally becomes zero at the speed at which the tractive effort developed by the motor becomes exactly equal to the resistance to motion of the train.
(ii) Free Run or Constant Speed Run:
At the end of speed curve running i.e., at t2 the train attains the maximum speed. During this period the train runs with constant speed attained at and constant power is drawn.
ADVERTISEMENTS:
(iii) Coasting:
At the end of free running period (i.e., at t3) power supply is cut off and the train is allowed to run under its own momentum. The speed of train starts decreasing on account of resistance to the motion of train. The rate of decrease of speed during coasting period is known as coasting retardation.
(iv) Retardation or Braking Period:
At the end of coasting period (i.e., at t4) the brakes are applied to bring the train to rest. During this period speed decreases rapidly and finally reduces to zero.
Typical Speed-Time Curves:
1. Urban or City Service:
In urban or city service the distance between the two stops is comparatively very short (say 1 km or so). The time required for this run is very small (few minutes). The acceleration as well as retardation is required to be high so that high average speed and short time of run is obtained. The acceleration and retardation for urban service is between 1.5 and 4 kmphps and between 3 and 4 kmphps respectively. Free run is not present in this run. The coasting retardation is about 0.15 kmphps. The coasting period is also small. Typical speed time curve for urban service is shown in Fig. 11.2.
2. Suburban Service:
In this service the distance between the stops is little longer than urban service but smaller than main line service (say between 2 and 5 km). Free run is still not possible. Coasting is for a comparatively longer period. Acceleration and retardation required are as high as for urban service.
3. Main Line Service:
The distance between two stops in main line service is considerably more (usually more than 10 km). In this service free run is of longer duration. The duration of acceleration and retardation is a small fraction of total running time. Since rate of acceleration and retardation does not affect the average and schedule speeds, therefore, these are of little importance in main line service.
Characteristics of various types of services are given in Table 11.1.
The acceleration and free-running periods are governed by the speed-torque characteristics of the electric traction motors, and these must be available before this part of the curve can be determined. Coasting and braking are governed by the train resistance and the allowable braking retardation respectively. The actual shape of any particular speed-time curve may be somewhat different from the above due to the existence of gradients and with different lengths of run.
Crest Speed, Average Speed and Schedule Speed of Train:
Crest Speed:
The maximum speed attained by the vehicle during the run is known as crest speed.
Average Speed:
The mean of the speeds from start to stop i.e., the distance covered between two stops divided by the actual time of run is known as average speed.
Mathematically average speed = Distance between stops/Actual time of run, T
Schedule Speed:
The ratio of distance covered between two stops and total time of run including time of stop is known as schedule speed.
Mathematically schedule speed = Distance between stops/ (Actual time of run + stop time)
From above it is obvious that the schedule speed is always smaller than the average speed. The difference is large in case of urban and suburban services and is negligibly small in case of main line service.
Factors Affecting Schedule Speed of Train:
The schedule speed of a given train when running on a given service (i.e., with a given distance between stations) is affected by the following factors:
1. Acceleration and braking retardation.
2. Maximum or crest speed.
3. Duration of stop.
1. Effect of Acceleration and Braking Retardation:
For a given run and with fixed crest speed the increase in acceleration will result in decrease in actual time of run and, therefore, increase in schedule speed. Similarly increase in braking retardation will affect the schedule speed. Variation in acceleration and retardation will have more effect on schedule speed in case of shorter distance run in comparison to longer distance run.
2. Effect of Maximum Speed:
For a constant distance run and with fixed acceleration and retardation the actual time of run will decrease, and therefore, schedule speed will increase with the increase in crest speed. The effect of variation in crest speed on schedule speed is considerable in case of long distance run.
3. Effect of Duration of Stop:
For a given average speed the schedule speed will increase by reducing the duration of stop. The variation in duration of stop will affect the schedule speed more in case of shorter distance run as compared to longer distance run. It is because stops in case of urban and suburban services are kept very small (say 15 to 20 seconds). When the distance between stations is much larger and duration of actual run is long as in case of main line service, station stop has less conspicuous effect on the schedule speed.
Simplified Speed-Time Curves of Train:
In order to study the performance of a service at different schedule speeds the speed-time curves are replaced by simple geometric shaped curves. From these simplified curves the relationships between acceleration, retardation, average speed and distance can be easily worked out. These can have either quadrilateral or trapezoidal shape.
The speed-time curve of an urban service can be replaced by an equivalent speed-time curve of simple quadrilateral shape. The speed-time curve of a main line service is best and most easily replaced by a trapezoid. Since the area of the speed- time curve represents the total distance travelled hence the areas of the two curves should be same.
The values of acceleration and retardation are also kept the same as those of the original speed-time curve. In case of simplified trapezoidal speed-time curve, speed curve running and coasting periods are replaced by constant speed period, as illustrated in Fig. 11.4 (a). While in case of quadrilateral speed-time curve, initial acceleration and coasting periods are extended, as illustrated in Fig. 11.4 (b).
The following examples illustrate the methods of calculations:
1. Calculations by Trapezoidal Speed-Time Curve:
Let α = Acceleration in kmphps
β = Retardation in kmphps
Vm = Crest speed in kmph
T = Total time of run in seconds.
Time for acceleration in seconds, t1 = Vm/α
Time for retardation in seconds, t3 = Vm/β
Time for free running in seconds, t2 = T – (t1 + t3)
= T – (Vm/α + Vm/β)
Total distance of run in km,
S = Distance travelled during acceleration
+ distance travelled during free run
+ distance travelled during braking
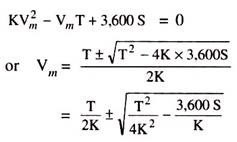
The +ve sign cannot be adopted, as value of Vm obtained by using +ve sign will be much higher than that is possible in practice. Hence -ve sign will be used and, therefore, we have
From the above equation unknown quantity can be determined by substituting the value of known quantities.
2. Calculation by Quadrilateral Speed-Time Curve:
Let α = Acceleration in kmphps
βc = Coasting retardation in kmphps
β = Braking retardation in kmphps
V1 = Maximum speed at the end of acceleration in kmph
V2 = Speed at the end of coasting in kmph
T = Total time of run in seconds
Time of acceleration in seconds, t1 = V1/α
Time of coasting in seconds, t2 = (V1 –V2) / βc
Time of braking in seconds, t3 = V2/β
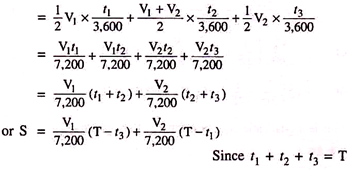
Total distance travelled in km,
S = Distance travelled during acceleration + distance travelled during coasting + distance travelled during retardation
Solving Eqs. (11.3) and (11.4) values of S, V1, V2 etc. can be obtained.
Mechanics of Train Movement:
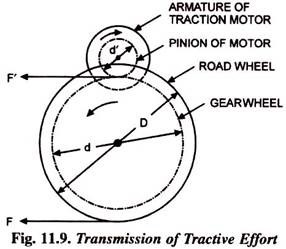
Essential driving mechanism of an electric locomotive is shown in Fig. 11.9. The armature of the driving motor has a pinion of diameter d’ attached to it. The tractive effort at the edge of the pinion is transferred to the driving wheel by means of a gearwheel.
Let the driving motor exert a torque T in Nm.
Tractive effort at the edge of pinion is given by the equation-
Let the driving motor exert a torque T in Nm.
Tractive effort at the edge of pinion is given by the equation-
T = F’ (d’/2) or F’ = 2T/d’
Tractive effort transferred to the driving wheel-
where d is diameter of gearwheel in metres, D is diameter of driving wheel in metres and η is the efficiency of transmission,
γ is the gear ratio and is equal to d/d’.
The maximum frictional force between the driving wheel and the track = µW where µ is the coefficient of adhesion between the driving wheel and the track and W is the weight of the train on the driving axles (called adhesive weight). Slipping will not take place unless tractive effort F > µW. For motion of trains without slipping tractive effort F should be less than or at the most equal to µW but in no case greater than µW.
The magnitude of the tractive effort that can be employed for propulsion, therefore, depends upon the weight coming over the driving wheels and the coefficient of adhesion between the driving wheel and the track. The coefficient of adhesion is defined as
i.e., Coefficient of adhesion,
µ = Maximum tractive effort that can be applied without slipping of wheels/Adhesive weight (Weight on the driving wheels) ……. (11.6)
The coefficient of adhesion reduces with the increase in speed as shown below in Table 11.2.
The normal value of coefficient of adhesion with clean dry rails is 0.25 and with wet or greasy rails the value may be as low as 0.08.
Electric traction has a very important advantage over steam traction and that is on account of greater adhesive weight – in a motor coach 100 per cent of the weight is on the driving wheels, in an electric locomotive 70 per cent whereas in a steam locomotive less than 50 per cent.
The coefficient of adhesion in electric traction is also greater than that in steam traction due to the following two reasons:
(i) In electric traction the torque exerted is continuous whereas in steam traction the torque is pulsating which causes jolting and skidding.
(ii) In electric traction the driving wheels are distributed over a much greater length whereas in steam traction they are close to each other.
Since higher value of tractive effort can be used in electric traction, therefore, an electric train can be made to accelerate at a faster rate. This results in saving of time, especially when the distance between stops is small e.g., in urban and suburban areas.
Tractive Effort for Propulsion of Train:
The effective force, necessary to propel the train, at the wheels of locomotive is called the tractive effort. It is tangential to the driving wheels and measured in newtons.
Total tractive effort required to run a train on track = Tractive effort required for linear and angular acceleration + tractive effort to overcome the effect of gravity + tractive effort to overcome the train resistance.
or Ft= Fa ± Fg + Fr …(11.7)
1. Tractive Effort for Acceleration:
According to laws of dynamics force is required to accelerate the motion of the body and is given by the expression
Force = Mass × acceleration
Consider a train of weight W tonnes being accelerated at a kmphps
The weight of train = 1,000 W kgf
Mass of train, m = 1,000 W kg
Acceleration = α kmphps
= α × 1,000/3,600 m/s2
= 0.2778 α m/s2
Tractive effort required for linear acceleration,
Fa = mα
= 1,000 W × 0.2778 α
= 277.8 W α newtons …(11.8)
With the linear acceleration of the train, the rotating parts of the train such as wheels and motors also accelerate in an angular direction, and therefore, the tractive effort required is equal to the arithmetic sum of tractive effort required to have the angular acceleration of rotating parts and tractive effort required to have the linear acceleration. The tractive effort required to have the angular acceleration depends upon the individual weight, radius of gyration etc. of the rotating parts requiring angular acceleration. Hence the equivalent or accelerating weight of the train is taken as We, which is higher than the dead weight W requiring linear acceleration to consider the tractive effort for the angular acceleration. In practice We is higher than W by 8 to 15%. The normal value lies between 10 and 12 per cent.
Hence tractive effort required for acceleration-
Fa = 277.8 We α newtons …(11.9)
2. Tractive Effort for Overcoming the Effect of Gravity:
When a train is on a slope, a force of gravity equal to the component of the dead weight along the slope acts on the train and tends to cause its motion down the gradient or slope. Hence force due to gradient, Fg = 1,000 W sin θ kg …(11.10)
But in railway work gradient is expressed as rise in metres in a track distance of 100 metres and is denoted as ‘percentage gradient’ (G%).
i.e., G = Sin θ × 100
or sin θ = G/100
Substituting sin θ = G/100 in E.q. (11.10) we have,
Fg = 1,000 W x G/100
= 10 WG kg = 10WG x 9.81
= 98.1 WG newtons …. (11.11)
When the train is going up a gradient, the tractive effort will be required to balance this force due to gradient but while going down the gradient, the force will add to the tractive effort.
3. Tractive Effort for Overcoming Train Resistance:
Train resistance consists of all the forces resisting the motion of a train when it is running at uniform speed on a straight and level track. Under these circumstances the whole of the energy output from the driving axles is expended against train resistance.
Train resistance is due to:
(i) The friction at the various parts of the rolling stock
(ii) Friction at the track and
(iii) Air resistance.
The first two components constitute the mechanical resistance component of train resistance. The train resistance depends upon various factors, such as shape, size and condition of track etc., and is expressed in newtons per tonne of the dead weight. For a normal train the value of specific resistance has been 40 to 70 newtons/tonne. The general equation for train resistance is given as
R = k1 + k2V + k3V2 …(11.12)
where k1, k2 and k3 are constants depending upon the train and the track, R is the resistance in newtons and V is the speed in kmph. The first two terms represent the mechanical resistance and the last term represents air resistance.
Tractive effort required to overcome the train resistance,
Fr = W x r newtons …(11.13)
where r is the specific resistance in newtons per tonne of the dead weight.
Total tractive effort required,
Ft = Fa ± Fg + Fr =277.8 Wα ± 98.1 WG + Wr …(11.14)
+ ve sign for the motion up the gradient and
-ve sign for the motion down the gradient.
Power Output from the Driving Axles:
Power, P =Rate of doing work
=Tractive effort x (distance/time)
= Tractive effort x speed
= Ft x v where Ft is in newtons and v is in m/s
Energy Output from Driving Axles:
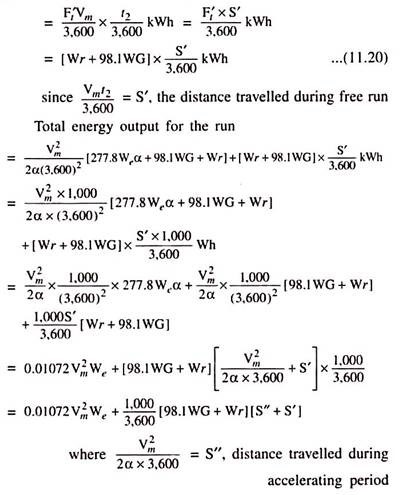
Assuming the run according to trapezoidal speed-time curve Total energy required for the run-
= Energy required during acceleration + energy required during free run
= Average power during acceleration x acceleration period + average power during free run x duration of free run
where Vm is the maximum speed in kmph, t1, is the time of acceleration in seconds, t2 is the time of free run in seconds, Ft is the tractive effort required during acceleration in newtons and Ft is the tractive effort required during free run in newtons. Instead of expressing the energy in kWh, it is more convenient for the purpose of comparison to introduce the weight of the train and the distance of run and to express the energy in watt-hours per tonne-km.
This quantity is called specific energy output, and is used for comparing the dynamical performances of trains operating to different schedules.
The energy input to the motors is called the energy consumption of the train, since it is the energy consumed for propelling the train. The total energy drawn from the distribution system will be greater than this by the quantity required for lighting, heating, control and braking.
The energy consumption can be expressed in watt-hours per tonne-km.
The above quantity is called the specific energy consumption.
Determination of Specific Energy Output Using Simplified Speed-Time Curve:
Let the track have a gradient of G per cent throughout its run. Energy output to accelerate the train from rest to a speed Vm–
Energy output to run the train at the speed V against the gradient and resistance to motion
Factors Affecting Energy Consumption:
Energy consumption in propelling the train is required for:
1. Having the linear and angular acceleration;
2. Working against gravity while moving up the gradient;
3. Working against the resistance to motion;
4. Overcoming the losses due to gearing system and
5. Supplying losses in motors and other electrical system.
Energy required being the product of power and time depends upon the power required and the duration for which the power is taken.
1. The power (in watts) required in accelerating the train on level track depends upon the rate of acceleration α, the effective weight of the train We and the speed at the end of acceleration Vm, being equal to 77.17 VmWeα whereas the energy (in watts-hours) depends upon the rate of acceleration, effective weight of train, maximum speed and the time for which the train accelerates, being equal to 0.01072 VmWe α t.
2. The power (in watts) required in overcoming the force of gravity while going up the gradient being equal to 27.334 WG Vm depends upon the gradient. While going down the gradient the energy is returned back. The energy required or returned (in watt-seconds) is given by the expression 27.334 WG V r and, therefore, depends upon the gradient, dead weight of train, maximum speed and duration of run.
3. The power (in watts) required in overcoming the resistance to motion, is equal to 0.2778 Wr Vm and energy required = 0.2778 Wr Vmt watt-seconds. The expression for energy required indicates that it depends upon the resistance to motion, maximum speed and time of run.
The energy output of train for a given speed-time curve is independent of the type of drive employed, but energy consumption depends upon the type of drive employed.
Factors Affecting Specific Energy Consumption of an Electric Train Operating on a Given Schedule Speed:
The specific energy consumption of a train operating at a given schedule speed depends upon the following factors:
(a) Distance between stops
(b) Acceleration
(c) Retardation
(d) Maximum speed
(e) Nature of route and
(f) The type of train equipment.
Specific energy output is given by the expression Specific energy output
Specific energy output is independent of locomotive overall efficiency but the specific energy consumption being equal to specific energy output divided by locomotive overall efficiency depends upon the overall efficiency of the locomotive. Greater the overall efficiency lesser will be the specific energy consumption for a given specific energy output at axles.
The Eq. (11.25) clearly shows that specific energy consumption depends upon the maximum speed Vm, the distance travelled by the train while power is on, S1, the specific resistance r, gradient G and distance between stops. Greater the distance between stops lesser will be the specific energy consumption. For a given run at a given schedule speed, greater the value of acceleration and retardation, more will be the period of coasting and, therefore, lesser the period during which power is on i.e., S1 will be small and, therefore, specific energy consumption will accordingly be less. Steep gradient will involve more energy consumption even if regenerative braking is used. Similarly more the train resistance, greater will be the specific energy consumption.
How the specific energy consumption falls with the increase in value of acceleration (retardation) and distance of run is illustrated in Figs. 11.11 (a) and 11.11 (b) respectively.
Typical values of specific energy consumption are:
(i) 50 – 75 watt-hours per tonne-km for suburban services and
(ii) 20 – 30 watt-hours per tonne-km for main line service.
Dead Weight, Accelerating Weight and Adhesive Weight:
Dead Weight:
The total weight of locomotive and train to be pulled by the locomotive is known as dead weight.
Accelerating Weight:
The dead weight of the train i.e., the weight of locomotive and train can be considered to be divided into two parts:
1. The weight, which requires angular acceleration such as weight of wheels, axles, gears etc. and
2. The weight, which requires linear acceleration. Hence the effective weight, which is greater than dead weight is called the accelerating weight. Accelerating weight is taken 5 to 10 per cent more than dead weight.
Adhesive Weight:
The total weight to be carried on the driving wheels is known as the adhesive weight.


