In this article we will discuss about:- 1. Introduction to Jominy End-Quench Test for Hardenability of Steel 2. Correlation between Jominy Test Distance and Grossman Method, DI 3. Generation of Jominy Curve 4. Hardenability Bands 5. Calculation of Jominy Curve from Composition in Steels.
Contents:
- Introduction to Jominy End-Quench Test for Hardenability of Steels
- Important Aspect of Jominy End Quench Test
- Correlation between Jominy Test Distance and Grossman Method, DI
- Generation of Jominy Curve
- Use of Jominy Curve
- Calculation of Jominy Curve from Composition in Steels
- Hardenability Bands
1. Introduction to Jominy End-Quench Test for Hardenability of Steels:
The Grossman method provides a quantitative measure of the hardenability in terms of ideal diameter. From the practical stand-point, however, this method of quenching a series of rounds is laborious, difficult and expensive. This is particularly so with increasing hardenability, since the number of pieces to be prepared, quenched, sectioned and hardness-traversed become large. Moreover, rounds of sufficient diameters of that steel are not always readily available.
ADVERTISEMENTS:
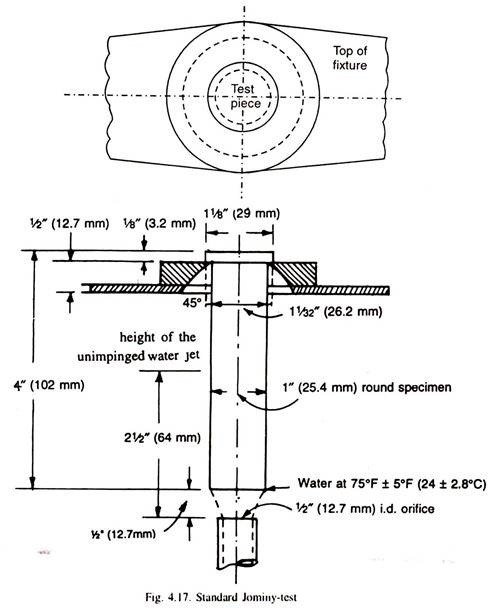
Jominy end-quench test is quite simple and easy test, and is thus, almost universally employed for the determination of hardenability. For this test, a slightly oversized bar of steel is normalisad at about 66°C (≈ 150°F) above Ac3, and then machined to the final dimensions of 4″ (102 mm) long and 1″ (25.4 mm) diameter (Fig. 4.17).
Machining removes any decarburised layer formed in the normalising treatment. The machined bar is put inside a closed box, half-filled with cast iron chips to prevent decarburisation, and then austenitised for 30 minutes at about 22-23°C above Ac3.
Fig. 4.17. Standard Jominy-test specimen and fixture.
ADVERTISEMENTS:
Meanwhile, the special water-quenching device is kept ready. In this device, the diameter of the pipe opening is 1/2 inch. Specimen holder is such that the bottom of the specimen remains at 1/2 inch above the nozzle. The constant pressure of the water is such that the height of the impinged jet is 2 inch.
The water temperature is 75 ± 5°F. The Jominy-bar after austenitising is transferred to the quenching-device in less than 5 seconds, and almost simultaneously the stream of water is then directed against the bottom face of the specimen for not less than 10 minutes.
While doing the quenching, a condition of still air is maintained around the specimen. Thus, quenching operation consists of cooling one end of the Jominy-bar by a jet of water, i.e. cooling of the bar essentially takes place by unidirectional flow of heat towards the quenched-end. Heat loss from the specimen surfaces exposed to air is negligible in comparison.
The Jominy-bar, after quenching, is then prepared for hardness measurements by grinding two mutually parallel flat surfaces 0.015″ (4 mm) deep lengthwise on the bar. These surfaces are etched with 5% nital solution to remove tempered layer due to grinding.
The hardness of the bar is then measured, normally on Rockwell ‘C’ scale, on one of these flat surfaces at an interval of 1/16″ along the length, starting from the water-quenched end.
The hardness is plotted against the distance from the quenched end of the Jominy bar. Since the cooling rate decreases with the increasing distance from the quenched-end, increasing amount of non-martensitic products are formed and gradual decrease of hardness is observed.
ADVERTISEMENTS:
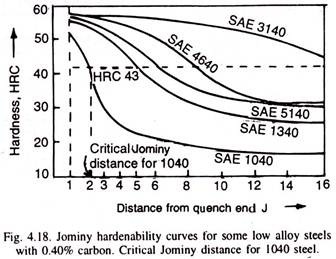
The resulting curve is called ‘Jominy hardenability curve’ and the distance from the quenched-end is known as Jominy distance-J. (1/16″ = one Jominy distance = J1). Fig. 4.18 illustrates typical Jominy curves of some low alloy steels.
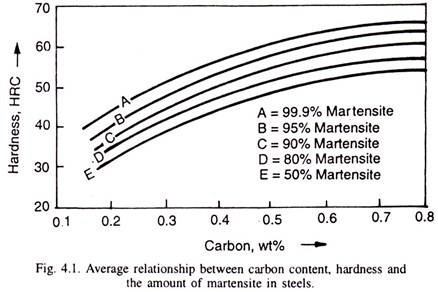
The inflection point (Fig. 4.18 for SAE 1040 steel) on this hardness versus distance curve usually corresponds to 50% martensite and is used as a measure of hardenability of the steels, or, knowing the carbon content, and thus, the hardness of 50% martensitic structure from Fig. 4.1, and then drawing a horizontal line at this hardness (HRC 43) in Fig. 4.18. The x-axis of each intersection point gives critical Jominy distance for that steel.
2. Important Aspect of Jominy End Quench Test:
ADVERTISEMENTS:
An important aspect of Jominy-end quench test is that each position of the specimen corresponds to a well-known cooling rate as illustrated in Fig. 4.29 (a) on the Jominy specimen. The basic postulate is that, it is the cooling rate that determines the amount of martensite, i.e., microstructure and thus, the hardness that develops al a given point in a steel specimen.
Therefore, if cooling rates as a function of position in parts of different diameters are known, it is possible to use Jominy curves to plot hardness profiles in the parts, i.e., two points in two pieces of same steel if cool at the same rate, the microstructure, the resulting hardness will be the same even in different quenching mediums.
Such correlations of cooling rate (by section-quench method) as a function of position in various sizes of bars and plates quenched in various media are available. The relationships between the 50% martensite position and the 3/4 radius, 1/2 radius, and the centre positions of oil-quenched bar (from 845°C) are illustrated in Fig. 4.29 (b).
3. Correlation between Jominy Test Distance and Grossman Method, D
I:
The correlation depends on the fundamental relationship between hardness and the rate of cooling. For example, if two points, one on the Jominy bar at a distance J from the quenched end and the other at the centre of quenched round of diameter, Dc, have same hardness, then two points have cooled at the same cooling rate. Thus, critical diameter, DI can be determined from end-quench hardenability.
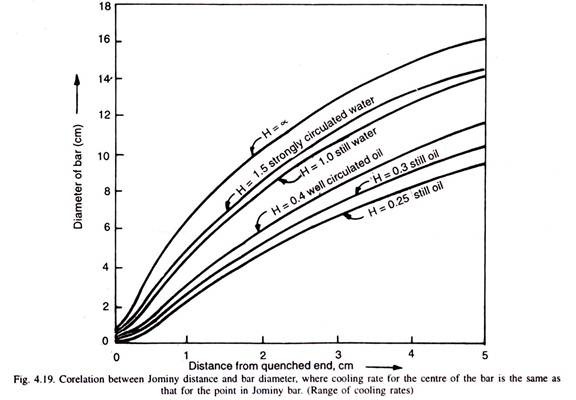
This idea can be extended to obtain DI from end-quench test. Grossman computed the cooling rate (in terms of half-time) of the centre of an ideally quenched round of diameter, DI. The cooling rate at any point on the Jominy bar at a distance J from the quenched-end has been similarly computed. The result is the relationship between DI (Grossmann) and Jominy distance J in Fig. 4.19 for a range of cooling baths, i.e., Jominy test can be used to get DI or DC from Fig. 4.19.
This diagram can also be used to determine the hardness at the centre of a round bar of a particular steel, provided the Jominy-end-quench test of that steel has been performed. If hardness values are needed at other points in round bars, at surface, or half-radius, suitable diagrams are available for use.
4. Generation of Jominy Curve:
As Jominy distance can be used to get DI, thus, it is possible to get the Jominy curve from the DI of a steel.
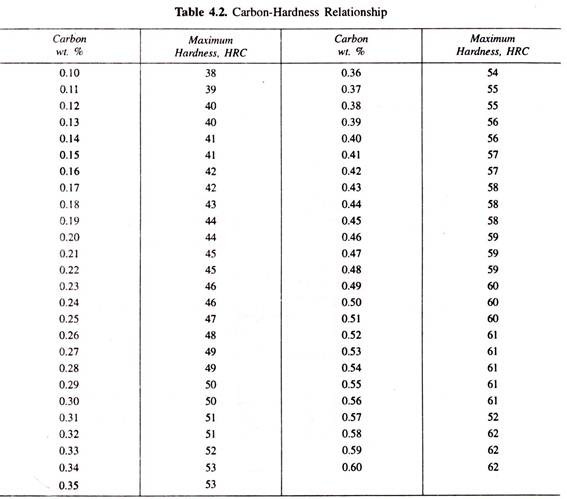
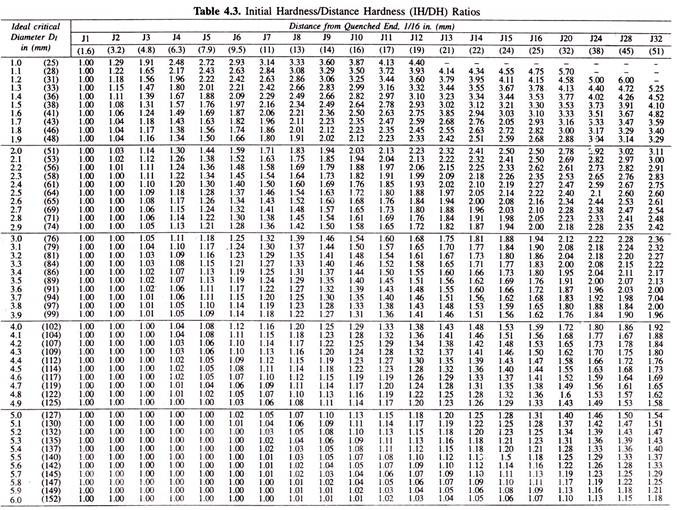
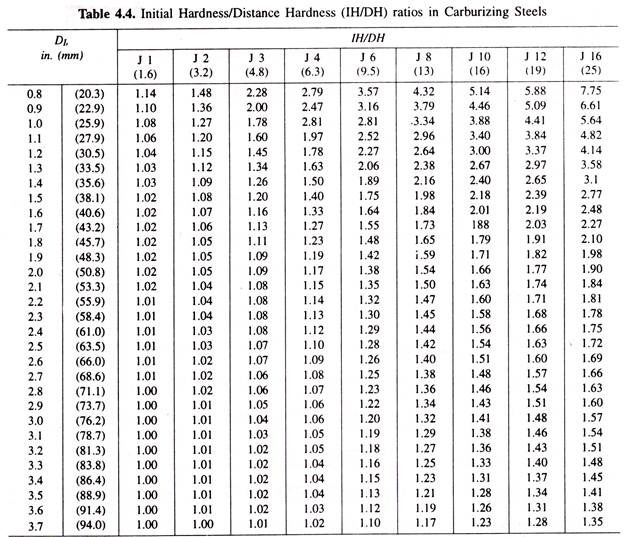
The hardenability of a steel in terms of DI can be calculated based on composition and the grain size of that steel. The ideal critical diameter DI can be used to generate a Jominy curve with the help of Table 4.2, 4.3 and 4.4.
The hardness at Jominy distance 1/16″ is a function of the carbon content only as only carbon determines the hardness of martensite in carbon and low alloy steels. This is known as initial hardness, IH. Table 4.2 can be used to obtain IH, knowing the carbon content of the steel. Hardness values at other Jominy distances are known as distance hardness, DH. The ratio of IH/DH is found to be same for all steels of same DI value. Table 4.3 gives these ratios for different DI values.
As IH is already known (table 4.2), DH can be calculated for various Jominy distances, and thus, it is possible to calculate the Jominy curves. This method generates curves which suits reasonably well for most hardenability grade steels, except boron steels, where for a given Dh the hardness drops off is faster in the inflection point range. Table 4.4 is for carburising grade steels (low carbon steels), and is slightly different.
Hot-Brine (H-B) Test for Shallow-Hardening Steels:
Jominy-end quench test is now widely used for hardenabilities in the range of DI = 1 – 6 inches. For shallow-hardening steels (DI < 1 inch), as the quenched end of Jominy piece is not hardened fully, Grange proposed a hot-brine (H – B) test. Deep hardening steels are normally air-hardening steels, and thus, the Jominy curve for such a steel in relatively Hat (steel 3140 in Fig. 4.18) and no useful information can be obtained from such a curve.
5. Use of Jominy Curves:
The Jominy curves may be used to compare the hardenability of different heats of the same grade of steel to serve as a method of quality control.
One very important application is in the selection of steels, based on the hardenability requirements. The hardenability requirement for some required part needs relationship between the quenching behaviour of the part in its actual production to the standard Jominy test bar, based on the concept of equivalent cooling rate.
Commonly, the equivalent cooling rate is cooling at 700°C, or the equal half cooling time. Normally, the equivalence between the given part to be made and the Jominy test is established by determining experimentally the Jominy equivalent condition, commonly called, Jec. The required part is made out of a steel and is quenched under desired condition.
A Jominy test piece is also made from the same steel and the Jominy curve is experimentally determined. The hardness distribution in the section of the part can now be related to the Jominy hardness from the quenched end, i.e. a position in the part can be described by a Jominy equivalent position in terms of Jominy distance.
Once the Jec for a part is known, the hardenability requirements for the steel from which it is to be produced can be made in terms of required Jominy hardenability curve, and then a steel could be selected having similar Jominy curve. Fig. 4.30 gives the method to determine Jec.
6. Calculation of Jominy Curve from Composition in Steels:
As computers can handle complex equations easily, these are now being used to solve problems of computing hardenability. Using multiple regression analysis and proceeding from the chemical composition. Just has obtained equation to predict hardness as a function of Jominy distance to be calculated directly. It is observed that all alloying elements have an increasing effect up to a Jominy distance of about 10 mm, and then their effect remains practically constant.
Carbon starts off at a Jominy distance zero with a factor of 60, but all other alloying elements have zero factor at zero distance, i.e., Hardness at Jominy distance zero is solely governed by the carbon content. The factors vary negligibly for Jominy distances exceeding 7 mm.
Just equation is:
This gives hardness in Rockwell C at J distances in range 4/16 to 40/16 inch from the quenched end. Elements are in wt%. E is the distance from the quench end in sixteenths of an inch and K is the ASTM grain size number. For less than 4/16 inch, C has the effect on hardness, and thus, following equation holds for end face of the Jominy specimen-
The above two equations can be evaluated by calculators to obtain the hardenability curve. Thus, computers can be used to generate this curve. The curves are reasonably satisfactory.
Also,
Breens equation for boron steels- hardness at Jominy distances is:
J1 = 39.5 + 37.5 C
J2 = 38.6 + 37.9 C
J3 = 38.1 + 37.8 C
J4 = 36.3 + 41.1 C
J5 = 23.6 + 44.6 C + 8Mn + 10.2 Cr
J6 = 5.3 + 58.0 C + 16.2 Mn + 30.4 Cr
J7 = -27.6 + 65.5 C + 35.1 Mn + 66.0 Cr
J8 = -40.7 + 54.4 C + 42.0 Mn + 93.6 Cr
J10 = – 37.5 + 39.2 C + 37.3 Mn + 73.9 Cr
J12 = -31.2 + 37.5 C+ 29.9 Mn + 54.8 Cr
The equations are valid in composition range:
C = 0.25 – 0.35%: Mn = 1.2 – 1.38%; 5/ = 0.23 to 0.35%
M = 0.02 to 0.04%; Cr = 0.02 – 0.12%; Mo = 0.01 to 0.02%
and B = .0005 minimum.
7. Hardenability Bands:
A steel producer cannot commercially produce steel of exact given composition, and thus a composition range is specified while ordering to the producer. He produces a steel of one exact composition falling within the range of specification. This composition range for a given steel gives rise to two curves—the upper curve represents the hardness obtained with the upper limit of elements in composition for the steel, while the lower curve is that for the composition at the lower limit.
The area between the two curves in referred to as a hardenability, or Jominy band as shown in (Fig. 4.20):
Now a days, steels can be ordered to hardenability limits (H steels) to obtain hardenability within the specified limits. For every H steel, hardness limits (max. & min.) at each Jominy distance are tabulated and specifications are written in terms of these tabulations.
Various methods of specifications could be:
1. The maximum and minimum hardness at any desired point-such as, point A-A in Fig. 4.20, in the Jominy curve can be specified, corresponding to the section size of interest to the user.
2. The maximum and minimum Jominy distance at which a desired hardness is to be attained as at points B-B, can be specified.
3. Two maximum hardness values at two Jominy distances can be specified as at points C-C.
4. Two minimum hardness values at two Jominy distances can be specified as at D-D.
5. Maximum or minimum hardness at JI and some other Jominy distance.
For each steel part to be heat treated, it is essential to determine the minimum hardenability required for ‘ proper functioning of the part. Higher than the minimum, should not be specified as it increases the cost as well as increases danger of quench cracking.
For Example:
1. 80% martensite at the centre of largest section is normally needed for highly stressed parts, whereas for less highly stressed parts, 50% martensite is sufficient.
2. 80% martensite at the 3/4 radius position is needed for most automotive parts.
