The following methods evolved after field experience and observations are generally used in soil and water conservation for estimating the rate or the maximum rate of runoff that could occur from a particular catchment:
1. Rational Method:
In this method, the peak rate of runoff is given by the equation-
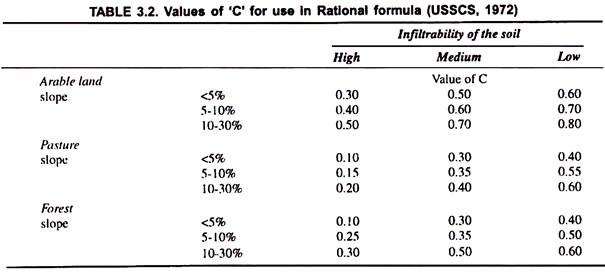
Runoff coefficient C is defined as the ratio of the peak runoff rate to the rainfall intensity. Values of C for different slopes and land use conditions, determined from field observations are given in Table 3.2.
ADVERTISEMENTS:
When the catchment has areas with different values of C, the weighted value of C should be calculated for the whole catchment. If C1, C2, C3,… are the values of the runoff coefficient for areas a1, a2, a3, … the weighted value given by-
Eq. 3.9 is dimensionally correct in metric units. In English units it should be remembered that one cubic feet per second flow rate of water for one hour will nearly equally to one acre inch.
ADVERTISEMENTS:
The value of the intensity of rainfall to be used in Eq. 3.9 should be calculated for the period equal to the time of concentration of the catchment. The time of concentration of a catchment is defined as the time required for water to flow from the most remote point of the catchment to the outlet.
When the duration of rainfall equals the time of concentration, all parts of the catchment will be able to contribute to the discharge at the outlet and as such the discharge will be maximum.
Empirical formulae are available for determining the time of concentration.
One such formula given by Kirpich (1940) is-
It has been mentioned by Haan et al. (1982) that the above relationship tends to correlate poorly with gauged runoff measurements of the time of concentration for very small (less than 5 sq. km.) catchments.
This is because small catchments are dominated by overland (shallow) flow conditions rather than having well defined network of channels. To overcome this difficulty they suggest the equation for estimating the time of concentration as –
The second term in the above equation accounts for the overland flow. In watersheds, the overland flow phase effectively has a maximum travel time because both laboratory and field studies have shown that overland flow conditions can seldom be maintained for a distance longer than 100 to 150 meters.
ADVERTISEMENTS:
Thus, the value of this term has a maximum value regardless of watershed size because of the upper limits specified for L0. However, as the size of watershed increases the maximum length of channel flow L tends to increase.
This means that, as watershed size becomes large, the channel flow portion of the time of concentration equation will dominate the overall value. Thus, the above equation will be valid for all sizes of watersheds.
The values of n suggested by them are as follows:
The time of concentration can also be assessed from estimates of the velocities of overland flow and the channel flow. If the overland flow traverses more than one kind of surface, the travel times across them should be added up.
ADVERTISEMENTS:
Jens and McPherson recommended velocities of 1 m/s for hill slopes of the order of 30 m in length ranging upto 0.25 m/s for 150 m long areas. For turf they recommended velocities of less than 0.06 m/s for the shorter slopes, of 0.08 m/s for the longer. Bare areas should be intermediate between these values, depending on Manning’s formula.
Knowing the time of concentration of a catchment, the maximum intensity of rainfall possible for this interval can be calculated. The area A of the watershed can be known from the topographical map of the area.
The Rational method outlined above is simple and widely accepted. For a proper application of the method, it is important to understand its limitations. The method assumes that the rainfall intensity is uniform over the entire watershed during the duration of the storm, a condition rarely satisfied. Again, for the runoff process to start, the losses due to depression storage and initial infiltration must be supplied.
In addition, there is a retardance to flow caused by effects of surface detention and channel storage. The Rational method does not take these factors into consideration. The value of ‘C’ the runoff coefficient assumed to be dependent only on watershed characteristics.
This does not seem to be correct as the value of C was observed to change with season as well as rainfall characteristics. These limitations of the Rational formula were discussed by Jaswant Singh (1964).
Example 1:
Estimate the peak rate of runoff for a 10 year frequency from a watershed of 25 hectares, having 15 hectares under cultivation (C = 0.5), 5 hectares under forests (C = 0.4) and 5 hectares under grass cover (C = 0.45). There is fall of 5 meters in a distance of 700 meters. The distance from the remotest point in the watershed to the outlet is 700 meters.
2. The Curve Number Method:
This method, also known as the Hydrologic Soil Cover Complex Number method, is based on the recharge capacity of the watershed. The recharge capacity is determined by antecedent moisture conditions and by the physical characteristics of the watershed.
Let Ia be the initial quantity of interception, depression storage and infiltration that must be satisfied by any rainfall before runoff can occur. It is assumed that the ratio of the actual runoff Q and the rainfall minus the initial loss P – Ia (maximum possible runoff) and the ratio of actual retention to the storage capacity S are related by-
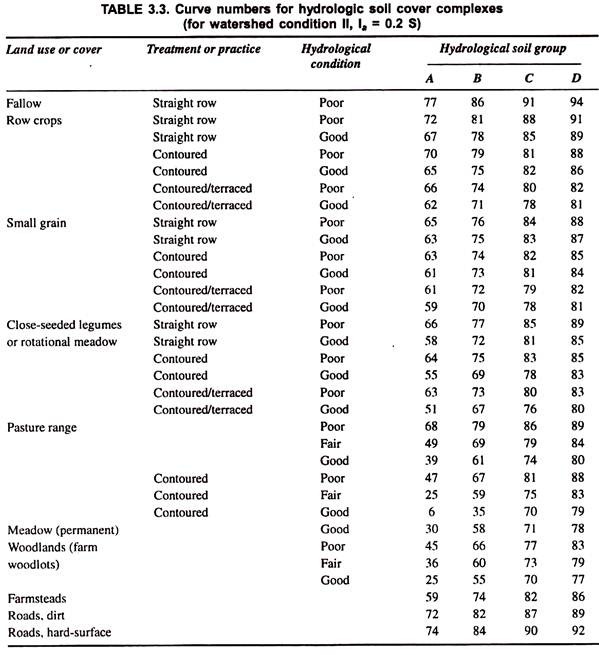
Where S is the recharge capacity of the watershed in mm. Curve numbers for different land use conditions and hydrologic soil groups are given in Table 3.3. The values apply to antecedent rainfall condition II which is considered as an average value.
Correction factors for other antecedent rainfall conditions are given in Table 3.4 and rainfall limits for estimating antecedent moisture conditions in Table 3.5.
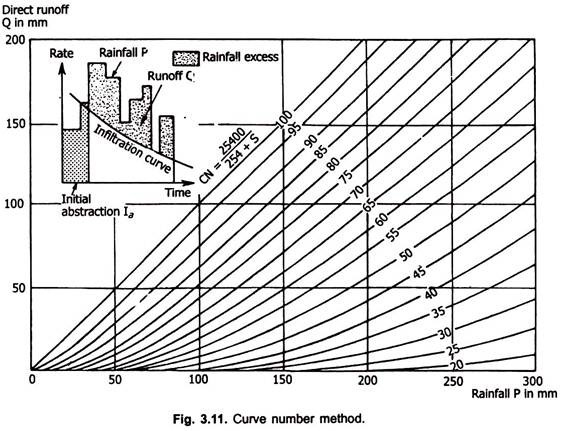
Knowing the curve number, the value of the recharge capacity S is calculated using Eq. 3.15 and using this value of S, runoff is calculated from Eq. 3.14. A plot of Eq. 3.14 for different curve numbers is shown in Fig. 3.11. A heterogeneous basin may be divided into subareas with different numbers and then a weighted curve number can be calculated for the entire basin.
If P and Q are expressed in inches, S in inches is obtained using the following equation:
Hydrologic Soil Group-A (Low Runoff Potential) – Soils having high infiltration rates when thoroughly wetted consisting chiefly of deep, well to excessively drained sands or gravels.
Hydrologic Soil Group-B (Moderately Low Runoff Potential) – Soils having moderate infiltration rates when thoroughly wetted and consisting chiefly of moderately deep to deep, moderately well to well drained soils with moderately fine to moderately coarse textures. These soils have a moderate rate of water transmission.
Hydrologic Soil Group-C (Moderately High Runoff Potential) – Soils having low infiltration rates when thoroughly wetted and consisting chiefly of moderately deep to deep, moderately well to well drained soils with moderately fine to moderately coarse textures.
Hydrologic Soil Group-D (High Runoff Potential) – Soils having very low infiltration rates when thoroughly wetted arid consisting chiefly of clay soils with high swelling potential, soils with a permanent high watertable and soils with clay layer at or near the surface.
Antecedent Moisture Condition:
Antecedent moisture condition (AMC) is used as an index of watershed wetness.
Three levels of AMC are used:
1. AMC I – Lowest runoff potential. The watershed soils are dry enough for satisfactory cultivation to take place.
2. AMC II – Average condition.
3. AMC III – Highest runoff potential. The watershed is practically saturated from antecedent rains.
The AMC group is determined using the 5 day antecedent rainfall. Table 3.5 is used for the purpose.
Example 2:
Find the maximum runoff for 50 years, recurrence interval for antecedent moisture condition III from a watershed with 40 ha of row crop cultivated good terraced land and 10 ha of good pasture land. The watershed is situated at 30° N latitude and 70°E longitude. The soil is of hydrologic soil group C. The time of concentration of the watershed = 0.48 hrs.
Solution:
Using Table 3.3, the curve numbers for the terraced land is 78 and for the good pasture land is 74.
Empirical Formulae:
Empirical formulae have been evolved for estimating the peak rate of runoff from large watersheds.
Value of C varies from 6.76 to 40.50 depending upon the location of the catchment. This formula is mainly applicable in South India.
These formulae have been evolved based upon observations and experience.
3. Soil Conservation Service Method:
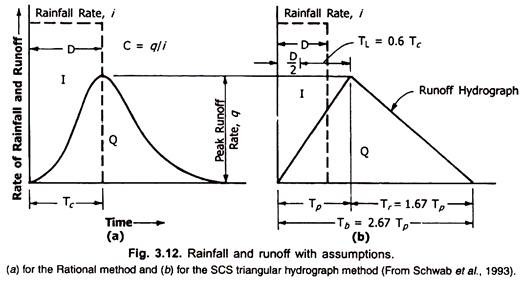
This method described by SCS (1990), uses the curve number method to develop a runoff hydrograph. A runoff hydrograph is a plot of the runoff rate versus time. A triangular hydrograph as shown in Fig. 3.12b is assumed.
The unit flow rates are developed for a given region using the time of concentration and the ratio of initial abstraction (0.2S in the curve number method) to 24-hour rainfall.


